What if you could see the condition of every bolted joint on your machines, without ever touching a single one?
That’s exactly what Strainlabs Analytics delivers. With Strainlabs bolts feeding continuous data into a powerful platform, you gain full visibility into bolt tension, joint stability, and maintenance needs – anytime, anywhere.
Watch the video below to see how it works:
Monitor every bolt and detect issues early
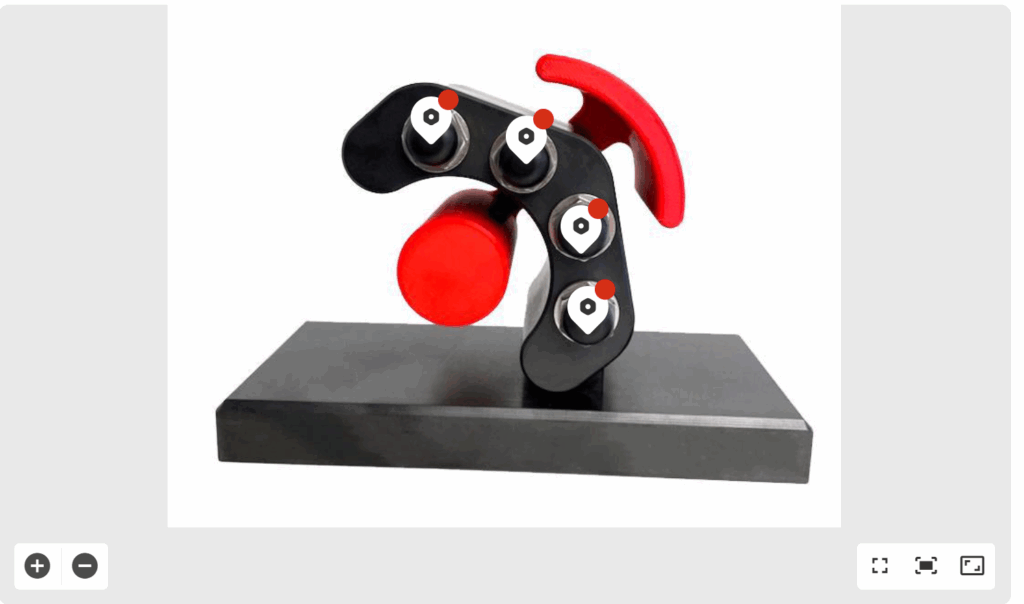
Strainlabs Analytics gives you a digital twin of your bolted connections -visualized in the layout. Each Strainlabs bolt transmits load data wirelessly, allowing the system to show exactly how each joint is behaving.
From a full system overview down to the load history of a single bolt, the platform helps you understand what’s happening over time and where attention is needed next.
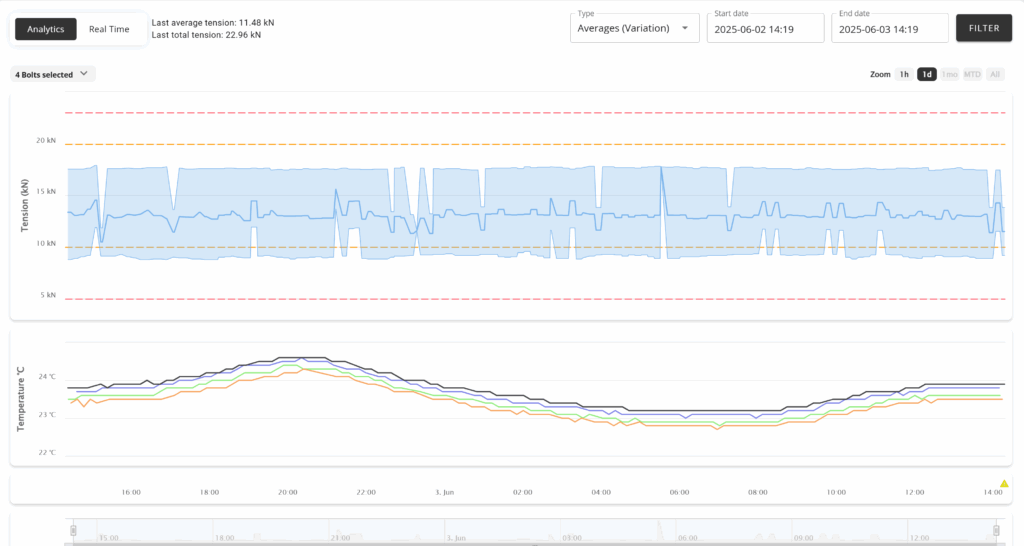
This picture showcases the inside of Strainlabs Analytics where you analyse preload over time.
Move from routine inspection to predictive maintenance
Strainlabs Analytics transforms your bolted joints from passive components into active data points. Instead of waiting for a fault or conducting routine checks, you get alerts, load trends, and status updates every ten minutes.
This shift means:
- Less manual inspection
- Earlier intervention
- Smarter planning
- Less downtime
The software runs directly in your browser and requires no special installation. It’s built to handle harsh industrial environments, remote assets, and complex machine setups – making it the perfect tool for maintenance teams.
Key benefits of Strainlabs Analytics
Featured
What it means
| Continuous insights into bolt load monitoring | Always know the status of each joint. |
| Visual layout view | See each bolt in its actual location |
| Load trend history | Detect loosening or anomalies early |
| Browser-based platform | No app or installation required |
| Designed for industry | Scalable, secure, and reliable |
By making the health of your bolted joints visible and actionable, Strainlabs Analytics helps your team work smarter, reduce risk, and stay ahead of failure.